| Approach Distinguishing features |
Axelrod | Fuzzy Cognitive Maps (FCM) | Luke Craven / System Effects | Participatory Stakeholder Mapping (PSM) | Classic QuIP | Causal Map default style |
|---|---|---|---|---|---|---|
| How is the causal map assembled? | ||||||
| Focus on how the world works | Y | Y | Y | ? | Y | |
| Focus on how people think | Y | ? | ? | Y | ||
| Focus on how different (groups of) people think | Y | - | Y(#_ftn1) | Y | ||
| Make deductions from how people think to how the world works | Y | Y? | Y? | |||
| Maps are a summary of qualitative data analysis of textual causal claims for each link | Y? | ? | N | Y | Y | |
| What is the nature of the links and the factors? | ||||||
| Include negative/minus as well as positive/plus links | Y | Y(#_ftn2) | Y | - | Y | |
| Links can have different strengths | Y | - | - | Y | ||
| Attempt to calculate resultant strength of multiple links influencing a factor | Y | - | - | - | ||
| Attempt to model dynamic changes over time | Y | - | - | - | ||
| Going beyond linear/additive combinations | - | - | - | - | - | |
| Historical versus theoretical | ||||||
| Focus on (evaluation of) past events | - | Y | Y | |||
| Focus on general understanding | Y | Y | - | Y |
(#_ftnref1) Individuals, not groups
(#_ftnref2) Separate maps for enablers and for barriers
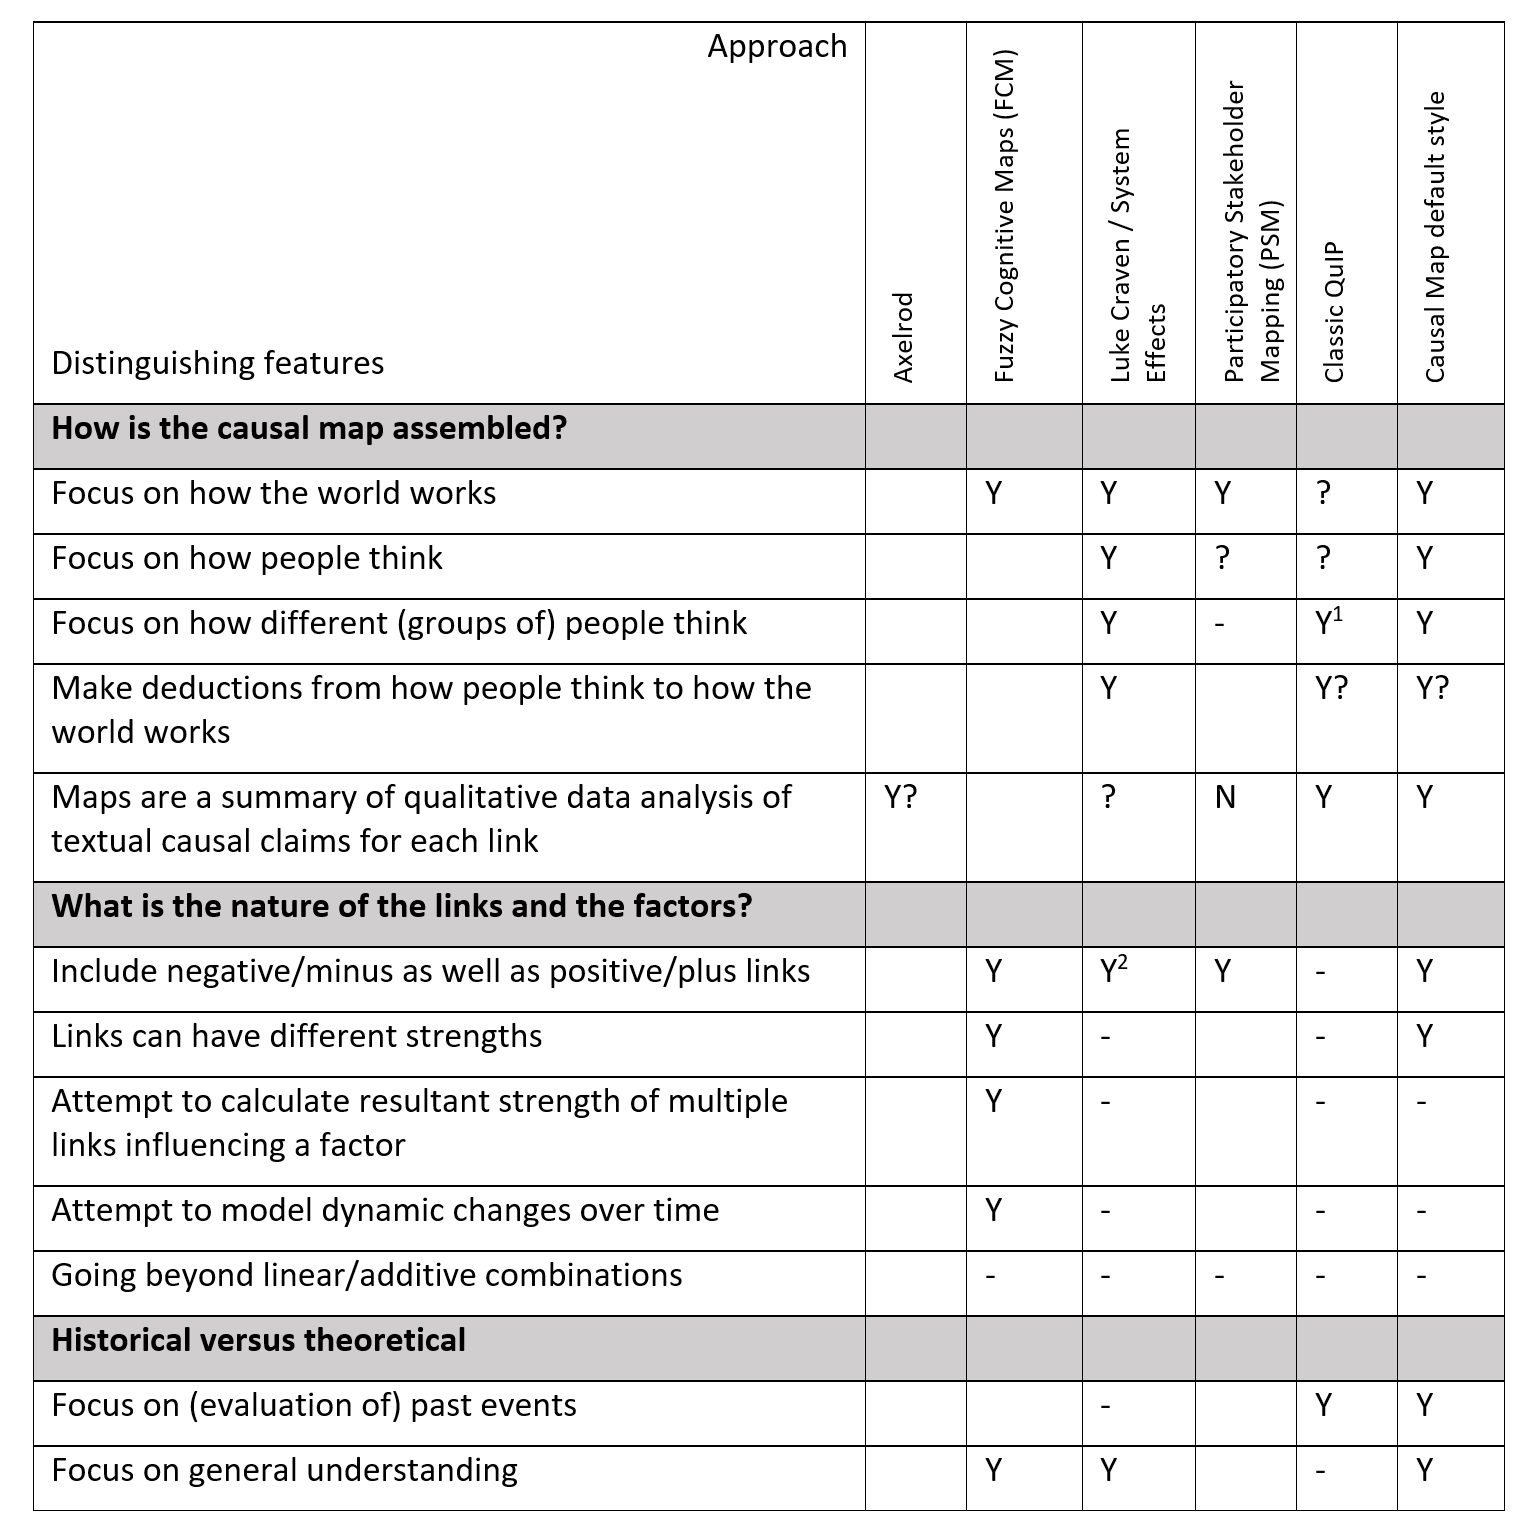
From (Powell et al. 2024)
Most evaluators are probably more familiar with related approaches under the term ‘systems mapping’, recently covered by Barbrook-Johnson and Penn (2022). They provide an overview table of relevant methods on pp. 169 ff. – fuzzy cognitive maps (FCM), participatory systems mapping (PSM), Bayesian belief networks (BBN), causal loop diagramming (CLD), systems dynamics (SD) and theory of change (ToC) – which will be briefly mentioned here.
SD, CLDs, FCMs and BBNs are all ways to encode information about networks of interconnected causal links and follow formal inference rules to make deductions based on them, for example, to calculate the strength of indirect effects or to predict behaviour over time. The oldest of the three methods, SD (Forrester, 1971), models flows of a substance (for example, of energy or money) within a network over time, whereas the other three methods model ‘bare’ causal connections between network elements. SD uses general mathematical functions to model the connections and explicitly models non-linear relationships. CLDs are related but mathematically simpler, modelling causal effects in a semi-quantitative way. FCMs might seem to be of more interest for causal mapping; Kosko’s original article on FCM (Kosko, 1986) takes Axelrod’s work as its starting point. This tradition (Chaib-Draa and Desharnais, 1998; Khan and Quaddus, 2004; Taber, 1991) was originally introduced to model causal reasoning (Kosko, 1986: 65): If person or group P believes the set of causal propositions making up a map M, the model attempts to predict the strength with which they could or should also believe some other propositions, for example, about indirect effects and how they might change over time. In practice, however, FCM is less interested in cognition than in making predictions about the world. The difference between FCM and the other three methods is more about the fuzzy logic used to make the predictions rather than about the cognitive nature of the data.
BBNs are also designed to make causal inferences by doing calculations with data about causal connections. While FCMs make essentially qualitative predictions such as ‘increasing’ and ‘decreasing’, BBNs use directed acyclic graphs (networks without loops) to make quantitative predictions about the probability of events, particularly about the probability that one event was the cause of another.
All four approaches are primarily ways to make predictions about causal effects within a network of factors, and (despite the words ‘cognitive’ and ‘belief’ in the names of two of the four) the relative lack of interest in who is doing the reasoning sets FCM, BBNs and SD apart from causal mapping as outlined earlier.
In the last few years, PSM has featured in several publications in evaluation journals and guides (Barbrook-Johnson and Penn, 2021; Hayward et al., 2020; Sedlacko et al., 2014; Wilkinson et al., 2021), alongside mapping of ‘systems effects’ (Craven, 2020). Indeed, Craven’s work (see also Craven, 2017) can be considered causal mapping with a particular emphasis on systems aspects. Barbrook-Johnson and Penn (2022) explicitly exclude causal maps from their overview of systems mapping because they are arguably included via FCM and because they ‘sometimes emphasise developing representations of individual mental models rather than representations of systems’ (p. 11). Nevertheless, PSM is closer to the tradition of causal mapping (and of more direct interest to evaluators) than the previous four approaches because it is a more concrete and pragmatic intervention to construct a map with specific group of stakeholders to support decisions. A devotee of causal mapping could claim that approaches like PSM are just variants of what they have been doing for the last 50 years, just as a devotee of systems mapping might consider causal mapping as a form of PSM.
Finally, logic models and ToC can be considered causal maps in which they make assertions about past or future causal links that one or more stakeholders believe to be important. They are also political artefacts that aim to justify and inform action by establishing an agreed synthesis of multiple perceptions of change and may also gain legitimacy by being the product of an agreed process of participatory planning and co-design. They do not, however, normally retain information about which stakeholder(s) believe which claim. Reflecting on logic models and theories of change provides one entry point for thinking more carefully both about who actually makes these claims and about the symbols and rules employed to construct them (Davies, 2018).
We think it is useful to distinguish this tradition of causal mapping from related activities in six ways, as set out in the following section. None of these distinctions are definitive, and many are shared with other approaches. To systems people who want to say that causal mapping is just systems mapping and to causal mappers who want to say that systems mapping is just causal mapping (and we have heard both arguments many times), we can only say, perhaps we should all just get to know each other first.
First, the raw material for causal maps comprises claims about, perceptions of or evidence for causal links. Causal maps are primarily epistemic, meaning that their constituent parts are about beliefs or evidence, not facts; yet their logic tends to be parallel to, and based upon, the logic of non-epistemic systems maps and similar diagrams that are broadly used across a range of sciences. Some systems mapping techniques are also sometimes concerned with stakeholder beliefs; causal mapping does this more systematically.
Second, causal maps tend to be unsophisticated about the types of causal connection they encode. To explain this, we should note that causal claims in ordinary language are expressed in an endless variety of ways: ‘C made E happen’, ‘C influenced E’, ‘C may have been necessary for E’, ‘C was one factor blocking E’, ‘C had a detrimental effect on E’, ‘C had a surprisingly small effect on E’ and so on. With a few exceptions, causal mapping analysts do not even try to formally encode this rich and unsystematic range of causal nuance, relying instead simply on the lowest common denominator: A link from X to Y means simply that someone claims that X somehow causally influences or influenced Y.
There is one exception: Many causal mapping approaches do accommodate information about the polarity of links, marking each link as either positive or negative, for example, the claim ‘the recession led to unemployment’ could be coded as a negative link from ‘the recession’ to ‘employment’.
In general, causal maps usually encode a belief about partial causal influences of C on E and only in special cases do they encode total or exclusive causation such that C entirely determines E. This also means that encoding a claim does not require us to make any judgement about the quality of the evidence or the ability of the source to judge that this link was causal (although it may be very useful to do so).
Third, causal mapping often handles large numbers of causal claims, sometimes many thousands. Handling large numbers of claims en masse in this way is made much easier because of the relatively unsophisticated nature of the way claims are coded (as discussed earlier).
Related approaches in evaluation tend to bring more sophisticated tools to bear on a much smaller number of causal links. In process tracing, for example, researchers may produce diagrams depicting claims about causal links but tend to focus on testing the strength of a relatively small number of specific ‘high-stakes’ causal links, whether through verbal reasoning, application of Boolean logic or Bayesian updating (Befani and Stedman-Bryce, 2017).
Fourth, causal maps may originate from one or many sources, each reporting on one or many cases. In a causal map, the links all originate from one person or document a ‘single-source’ or ‘individual’ or ‘idiographic’ causal map, as in Axelrod’s original work (Axelrod, 1976). But we can also draw causal maps that incorporate information from a variety of different sources, as illustrated in Figure 1.
The simplest causal maps refer to only one context and contain information from only one source (which may be the consensus view of several people, treated as speaking with a single voice). Various forms of systems mapping such as PSM could be understood as a special case of causal mapping in this sense.
There are many other variants. One source might give differentiated information about different cases or contexts, or many sources might give information about just one context, as when different water systems experts each give their (possibly differing) opinion about the same water catchment area, for example.
Another frequent type of causal map is drawn from many sources, each reporting on their own situation or context, such as their perception of drivers of change in their own lives. In coding and analysis of this sort of data, one source equals one case and one context; these can subsequently be aggregated across many sources who, for example, all share a similar context.
Fifth, causal maps do not necessarily specify a clear system boundary. The boundaries of a causal map are usually defined more loosely, partly by data collection but also by the sources themselves. Indeed, some systems proponents would say that the term ‘systems diagram’ simply signals a readiness to use systems approaches (Williams, 2022).
Finally, causal mapping, especially in management sciences and operations research, has nearly always been at least as interested in process as in the result. There is often a focus on the process of reaching consensus as part of the task of solving a business problem, rather than on the universal accuracy or validity of the final map.
Related#
References
Powell, Copestake, & Remnant (2024). Causal Mapping for Evaluators. https://doi.org/10.1177/13563890231196601.